Tips and Tricks for Debugging in Chrome Developer Tools

I love to develop and debug using Chrome Dev Tools. I find that the dev tools are generally easy to use, well documented and there are constantly new and experimental features coming out. I often use the Dev tools to pause code execution, inspect variables, and to perform Mobile First web development. In this post I’ll highlight some tips and shortcuts to increase your productivity.
Note: These tips are scoped to mac users.
Pretty print
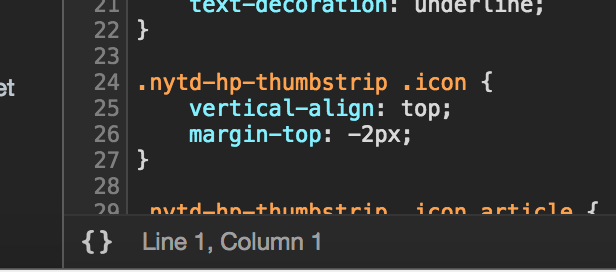
Let’s jump right in by making things look nice! Hello gorgeous, I mean Pretty Print :)
Clicking on the “{ }” on the bottom left hand side will Pretty print your js, css, or html
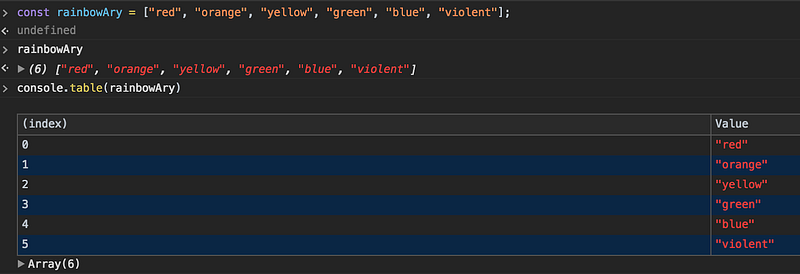
Another great display trick is console.table. Console.table displays data as a table which can greatly improve readability.
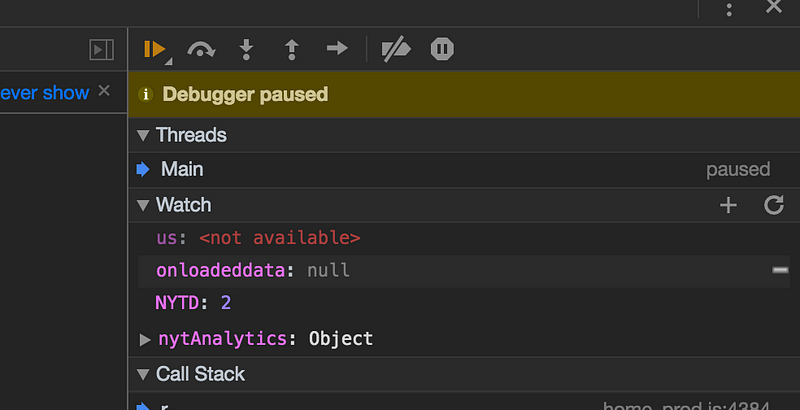
In the “Source’ tab of the Dev Tools, you can add an expression to the watch list. This can be very helpful by allowing you to see how a variable changes over time.
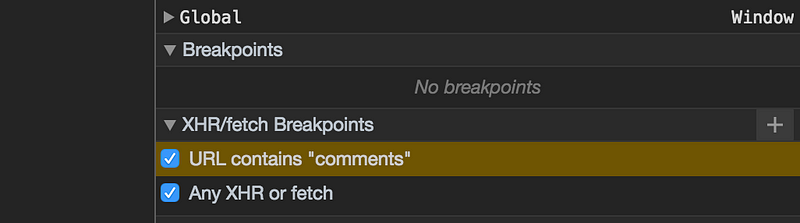
You can set XHR/fetch breakpoints in the Sources tab, on the right side anytime a url contains a specific string or on any XHR/fetch request. This will break on that xhr call.
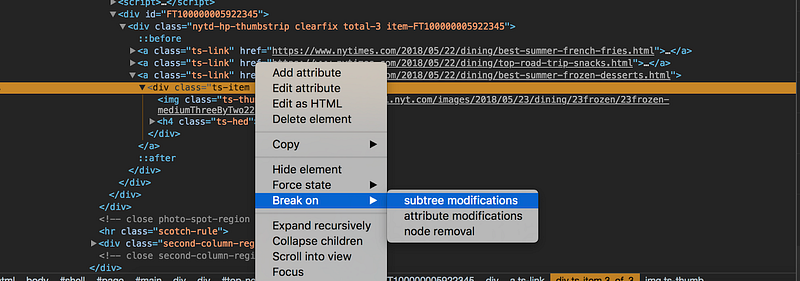
Another neat breakpoint trick is to break if any of an element’s children are modified. This is what happens when break on ‘Subtree Modifications’ is selected.
In the elements tab, right-click an element, ‘Break on’, ‘subtree modifications’ to set this. When a script traverses that element’s children the debugger will stop.
You can also modify html directly in the tree.In the ‘elements’ tab, once you have an element selected, you can right click and edit/change the html inline.

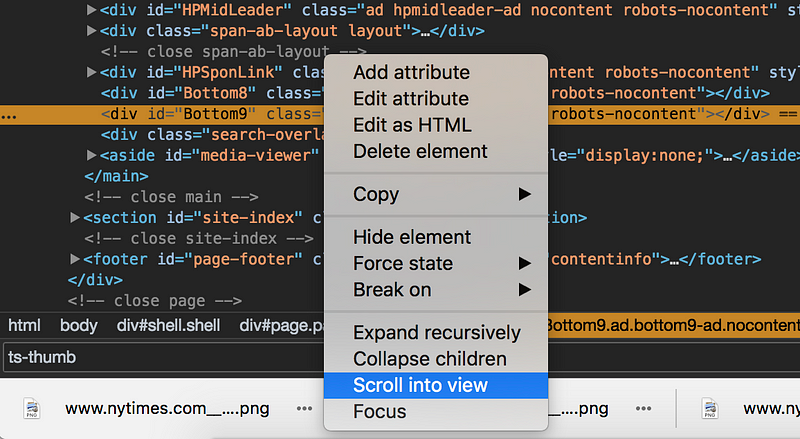
If you are searching through your html and you come across an element and would like to see what it looks like, click the element, right click, and select “Scroll into view” this will bring up the element. This is particularly handy when you’ve been debugging for a while and forget where you were or can’t seem to find that element on that page.
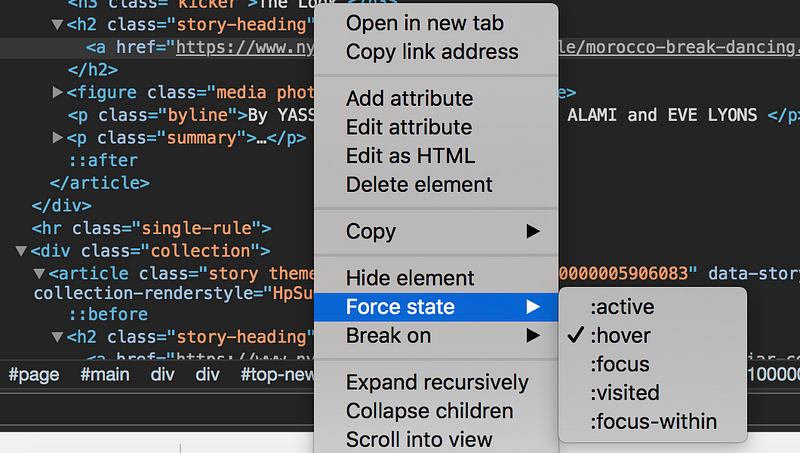
Would you like to see how a pseudo state look on a certain element? Find the element, right click, select ‘Force state’ and select the pseudo state to force. This can be really helpful in checking to see what an element’s hover or visited state is.
It might be helpful to replay a network request via CURL. Here’s a link to a post I found that walks you through that process.
Shortcuts:
Open Dev tools: ⌘ + Option + j
Open file: ⌘ + p
Toggle between dev tool docking positions: ⌘ + shift + d
Navigate to a specific line of code: Control + g
Clear console: ⌘ + k
Toggle device mode: ⌘ + shift + m
getEventListeners($(‘selector’)) returns an array of objects thats contains all of the events that are bound to that element
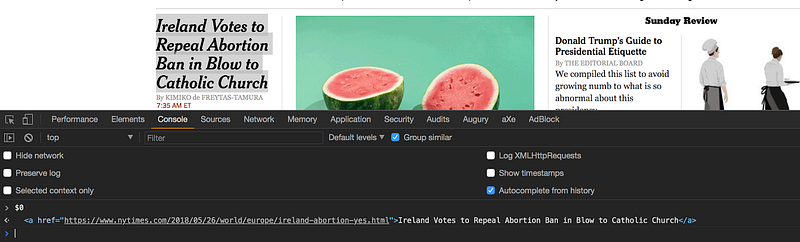
Reference the currently selected element in the console: type ‘$0’
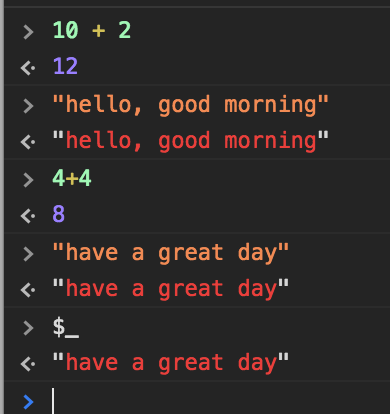
Get the value of the last operation from console: type ‘$_’
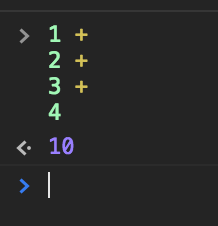
Write commands that span multiple lines in console: shift + enter
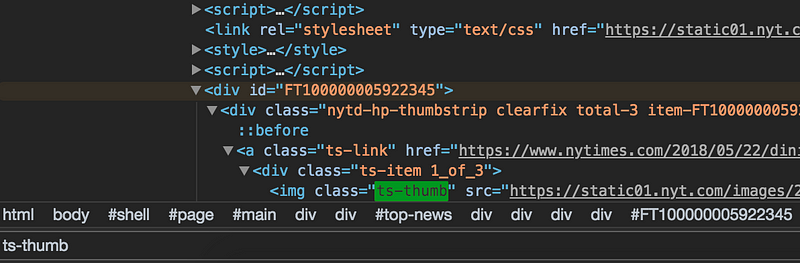
Find an html/css element on the page: ⌘ + f
In the screenshot below I am searching for ‘ts-thumb’.
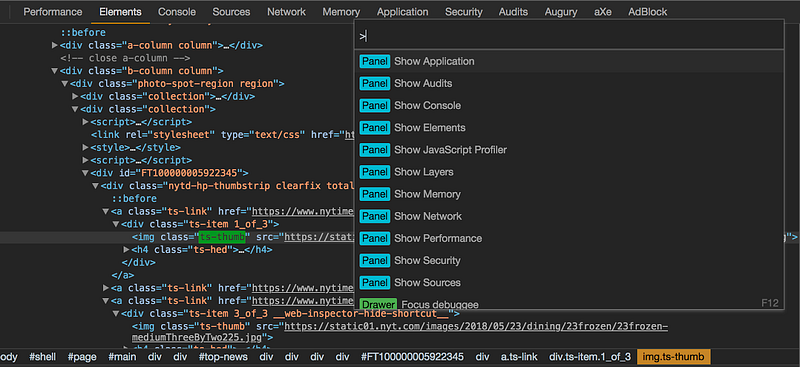
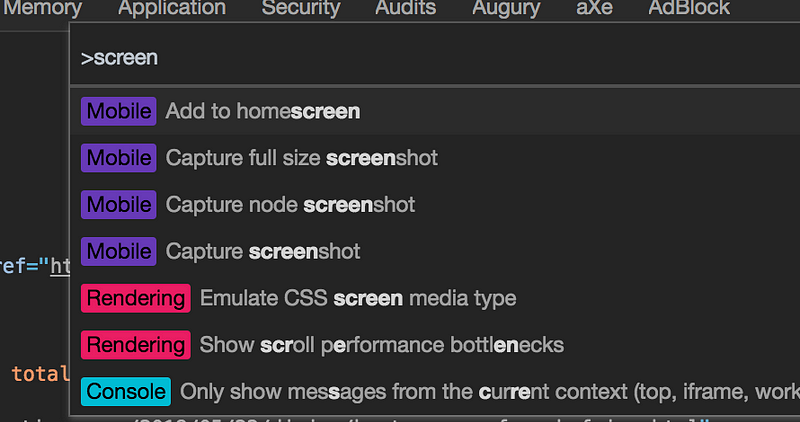
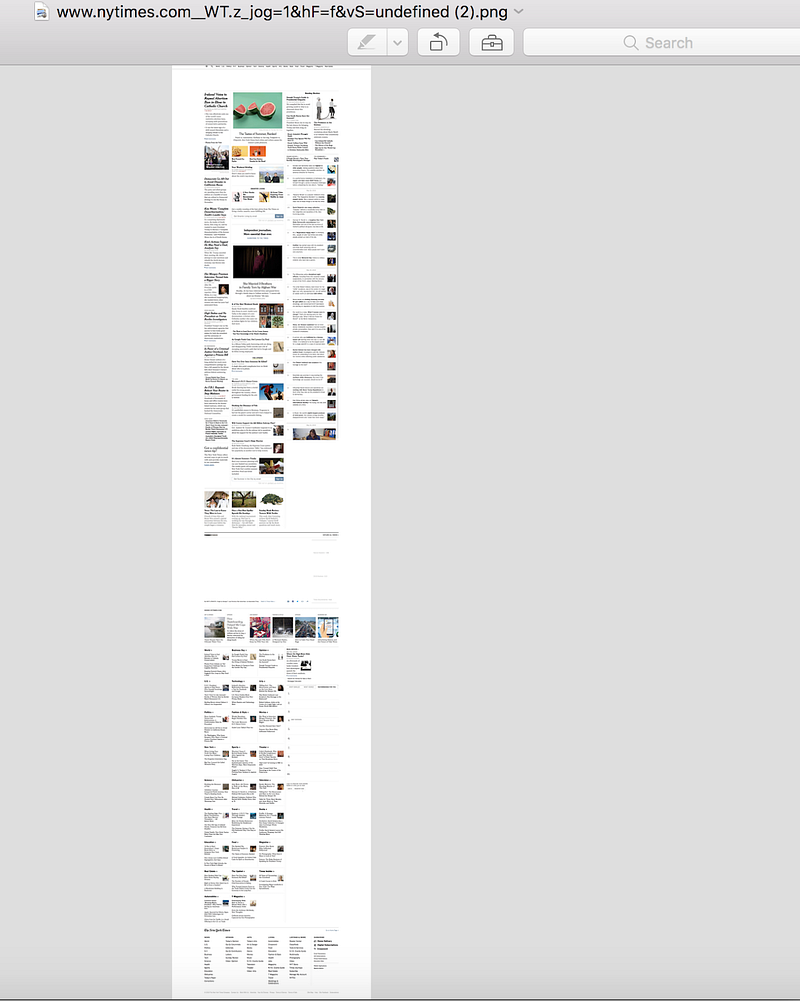
Capture a screenshot: command + shift + p over an element that you would like to capture
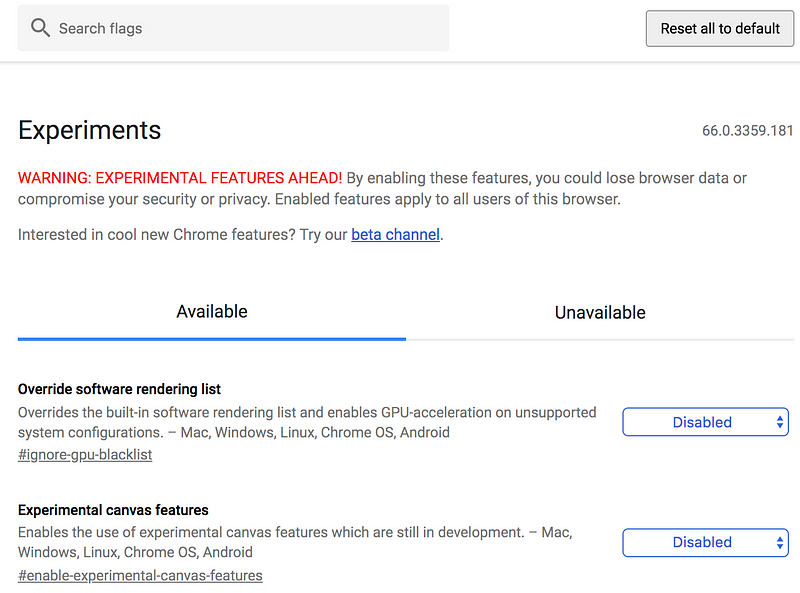
If you are interested in playing around with experimental Chrome Develop features, check out chrome://flags/. It allows you to turn certain Chrome features on and off.
Here are some additional resources for debugging using Chrome Developer Tools:
- Google Chrome Devtools
- Chrome Devtools Tips
- Google Chrome Devtools Shortcuts
- Dev Tips
- Javascript debugging tips using Chrome Devtools
Happy Debugging!